Size a custom lithium battery pack by converting the device’s load profile into an energy budget in watt-hours (Wh), dividing that by the pack’s nominal voltage to get capacity in ampere-hours (Ah), then adding explicit margin for temperature, discharge rate, allowable depth of discharge, conversion losses and end-of-life capacity fade. Peak and pulse currents are checked separately as a C-rate against the cell’s continuous and pulse ratings, and against the BMS overcurrent threshold. The output is not one number but a requirement set: nominal and end-of-discharge voltage, usable Wh at a stated temperature and discharge rate, peak current with its duration, and the conditions under which capacity is measured. This article gives the calculation sequence, a worked example, the margins to document, and the prototype tests that confirm the sizing before a design freeze.
Two distinctions prevent most sizing errors. First, Wh (energy) and Ah (charge) are not interchangeable: Wh equals nominal voltage multiplied by Ah, so a 12 V pack and a 24 V pack with the same Ah deliver different energy. Second, rated capacity is a measured quantity with conditions attached. IEC 61960-3:2017 specifies performance tests, designations, markings and dimensions for secondary lithium cells and batteries for portable applications, and IEC 62619:2022 specifies requirements and tests for the safe operation of secondary lithium cells and batteries used in industrial applications, including stationary ones. A capacity figure quoted without a discharge rate, temperature and cut-off voltage is not a specification. Our custom battery pack RFQ checklist covers the wider input set a supplier needs; here we work through the sizing arithmetic that produces those inputs.
Step 1: build the load profile before choosing a cell
Start from the device, not the battery. List every operating mode, the power it draws, how long it runs, and how often it repeats. Include standby and sleep currents, which are easy to forget and dominate the budget in devices that idle for long periods. Record peak current with its duration, because a 10 A pulse lasting 200 ms and a 10 A continuous draw impose very different requirements on the cells, the interconnects and the BMS. Also record the ambient temperature range during both discharge and charge, and the minimum voltage the load will accept.
Convert each mode to energy: energy (Wh) equals power (W) multiplied by duration (h). Sum the modes over the mission profile – one shift, one day, or one full discharge cycle, whichever the device must cover between charges. The worksheet below is a worked example for a portable industrial instrument. The values are illustrative inputs chosen to show the arithmetic; replace them with measured values from your own device.
| Operating mode (illustrative) | Power (W) | Duration per cycle (h) | Duty within cycle | Energy per cycle (Wh) |
|---|---|---|---|---|
| Active measurement | 12.0 | 2.0 | 2 h of 8 h shift | 24.0 |
| Display and radio, idle | 4.0 | 6.0 | 6 h of 8 h shift | 24.0 |
| Standby, shift remainder | 0.5 | 16.0 | 16 h to next charge | 8.0 |
| Motor start pulses | 60.0 peak | 0.2 h equivalent at full rate | 6 starts x 2 min | 12.0 |
| Total over one 24 h profile | – | – | – | 68.0 Wh |
Values above are an illustrative worked example, not measured data for any product. Energy per row is power x duration; the total is the raw mission energy the pack must deliver between charges. Note that the peak-power row is a power figure, not an average – it belongs in the C-rate check in Step 3, not in the energy budget alone.
Step 2: convert the energy budget to capacity, then apply margins
Convert the mission energy to charge by dividing by the pack’s nominal voltage. For the worked example, a 14.4 V nominal pack (four series groups at 3.6 V nominal per cell, a value to confirm against the chosen cell datasheet) needs 68.0 Wh / 14.4 V = 4.72 Ah of delivered charge. That figure is the starting point, not the answer. Each of the following margins increases the required rated capacity, and each should be written into the specification with its condition.
| Margin factor | Why it changes the number | How to apply it | Condition / basis to state |
|---|---|---|---|
| Converter efficiency | DC/DC and regulator losses draw more than the load uses | Divide delivered Wh by the measured or specified efficiency of the power path | Efficiency at the actual load current and input voltage; verify on the prototype, not from a headline number |
| Usable depth of discharge (DoD) | Capacity below the load’s cut-off voltage and above a reserved floor is unusable | Divide by the usable DoD fraction agreed for the voltage window | End-of-discharge voltage and any BMS reserve; align with the cell datasheet discharge curve |
| Temperature derating | Available capacity falls at low temperature and charge is restricted there | Size to the coldest discharge case, or provide a heated pack | Coldest ambient during discharge; see our cold-weather charging limits article for the charge-side constraint |
| Rate / C-rate effect | Capacity delivered at high discharge rate is lower than at the datasheet’s rated rate | Confirm delivered capacity at the actual peak and average rate | Discharge rate and temperature at which rated capacity is defined, per IEC 61960-3 performance tests |
| End-of-life capacity fade | A pack must meet runtime at end of warranty life, not only when new | Divide by the agreed end-of-life capacity retention fraction | Target retention and its cycle/calendar basis; see our cycle-life claim verification guide |
| Manufacturing and cell spread | Cell capacity and pack assembly vary within tolerance | Add the agreed tolerance band, then verify on production-intent samples | Cell binning tolerance and pack-level capacity acceptance limit |
No universal multiplier applies to any of these margins. Efficiency, usable DoD, retention and tolerance are programme-specific values that must come from the power-path design, the cell datasheet and the warranty target, then be verified by test. Treating them as a single rounded “safety factor” hides the assumptions and is the most common reason a pack that passed a spreadsheet fails on the bench.
Step 3: check peak current and C-rate
Capacity answers “how long”; C-rate answers “how hard”. C-rate is the discharge current divided by rated capacity, so a 5 A draw from a 5 Ah pack is 1C, and the same 5 A from a 2.5 Ah pack is 2C. Take the highest peak current from the load profile, divide by the candidate capacity, and compare the result with the cell’s continuous rating and its short-duration pulse rating, both at the coldest operating temperature. Also compare it with the BMS overcurrent trip threshold and its delay: a pack sized correctly for energy can still shut down on a motor-start pulse if the protection limit is set below the real inrush.
The pulse duration matters as much as the amplitude. A short pulse may be within the cell’s pulse rating and below the BMS trip delay, while a longer surge of the same amplitude is a continuous load. Record the duration explicitly in the requirement, as the RFQ checklist above describes. For portable sealed cells, IEC 62133-2:2017+A1:2021 defines the safety requirements and tests for the cells and batteries; for industrial packs the corresponding reference is IEC 62619. Which one applies depends on the application classification, and it should be settled before the pack architecture is fixed rather than discovered at the compliance stage.
Step 4: write the sizing into a requirement set
The calculation is only useful if it reaches the supplier as a set of testable requirements with units and conditions. The table below is the shape of that output; the values shown are illustrative and tied to the worked example, not recommendations.
| Requirement | Example value (illustrative) | Unit | Condition to state | How to verify |
|---|---|---|---|---|
| Nominal pack voltage | 14.4 (4 series groups) | V | Cell nominal voltage from the approved datasheet | Open-circuit voltage and cell count on the built pack |
| Mission energy between charges | 68.0 raw, plus margins | Wh | Full 24 h profile at stated ambient | Discharge the prototype through the real load profile |
| Rated capacity after margins | Value derived after all Step 2 margins | Ah | Discharge rate, 25 degrees C or specified case, cut-off voltage | Capacity test per IEC 61960-3 style conditions |
| Peak current and duration | 60 peak, 2 min bursts | A / min | Coldest operating temperature, full state of charge range | Pulse load test with BMS trip monitoring |
| Continuous current | Highest steady mode current | A | Worst-case mode and temperature | Thermal and voltage sag check at continuous load |
| End-of-discharge voltage | Load minimum and BMS cut-off | V | Under load, not at rest | Record voltage at the load during the discharge test |
Energy in Wh also has a logistics consequence. Air transport classification for rechargeable lithium batteries is based on Watt-hour rating, as set out in IATA’s lithium battery guidance; where the pack crosses a transport threshold, packaging, documentation and state-of-charge limits change. Settle the Wh figure early so the shipping route and the design do not have to be renegotiated after tooling.
Step 5: verify the sizing on a prototype
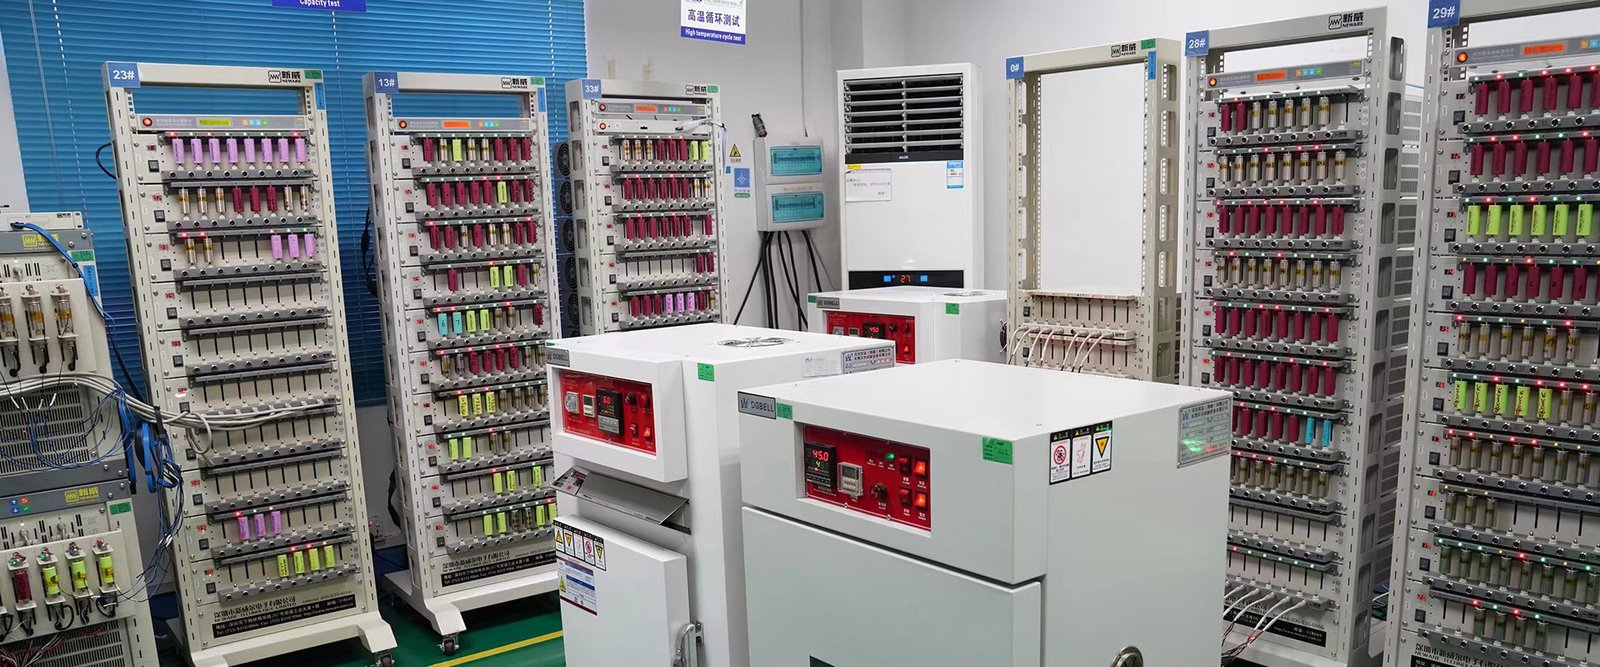
Close the loop with measurement, not arithmetic alone. Run the built pack through the real load profile at the specified temperature, log voltage and current at the load, and confirm it reaches the required runtime with the BMS still above its cut-off. Repeat at the coldest discharge case, and repeat the peak-pulse test to confirm the protection limit does not trip. Capacity and rate characterisation methods of the kind published by Sandia National Laboratories’ battery testing programme are a useful reference for how to define the measurement conditions so a supplier’s claim and your own bench result are comparable. If the prototype misses the target, the worksheet tells you which margin was optimistic rather than leaving you to guess.
Common questions
Can I size a pack from the device’s average power alone?
No. Average power gives the energy budget but hides peak current, pulse duration and cold-temperature behaviour, all of which can force a larger or differently configured pack. Keep the energy calculation and the C-rate check as separate steps.
Why does a pack with the quoted Ah not deliver the calculated runtime?
Because rated capacity is defined at a specific discharge rate, temperature and cut-off voltage. At a higher rate, lower temperature, or with an efficiency loss in the power path, the delivered Wh is lower. Compare like with like: measured delivered Wh under your conditions, not nameplate Ah.
When should the pack get a heated design instead of a larger capacity?
When the shortfall is caused by cold-temperature charge restriction or cold discharge loss rather than by total energy. A heated pack addresses the temperature condition; extra capacity does not. Our cold-weather charging article covers the charge-side limits that drive that decision.
What to do now
Write the load profile, apply each margin as a separate documented line, and send the resulting requirement set to suppliers as part of the RFQ rather than a single capacity number. For help turning a device profile into a pack specification, review our custom lithium-ion battery pack options or contact our engineering team with your load profile and operating temperature range.