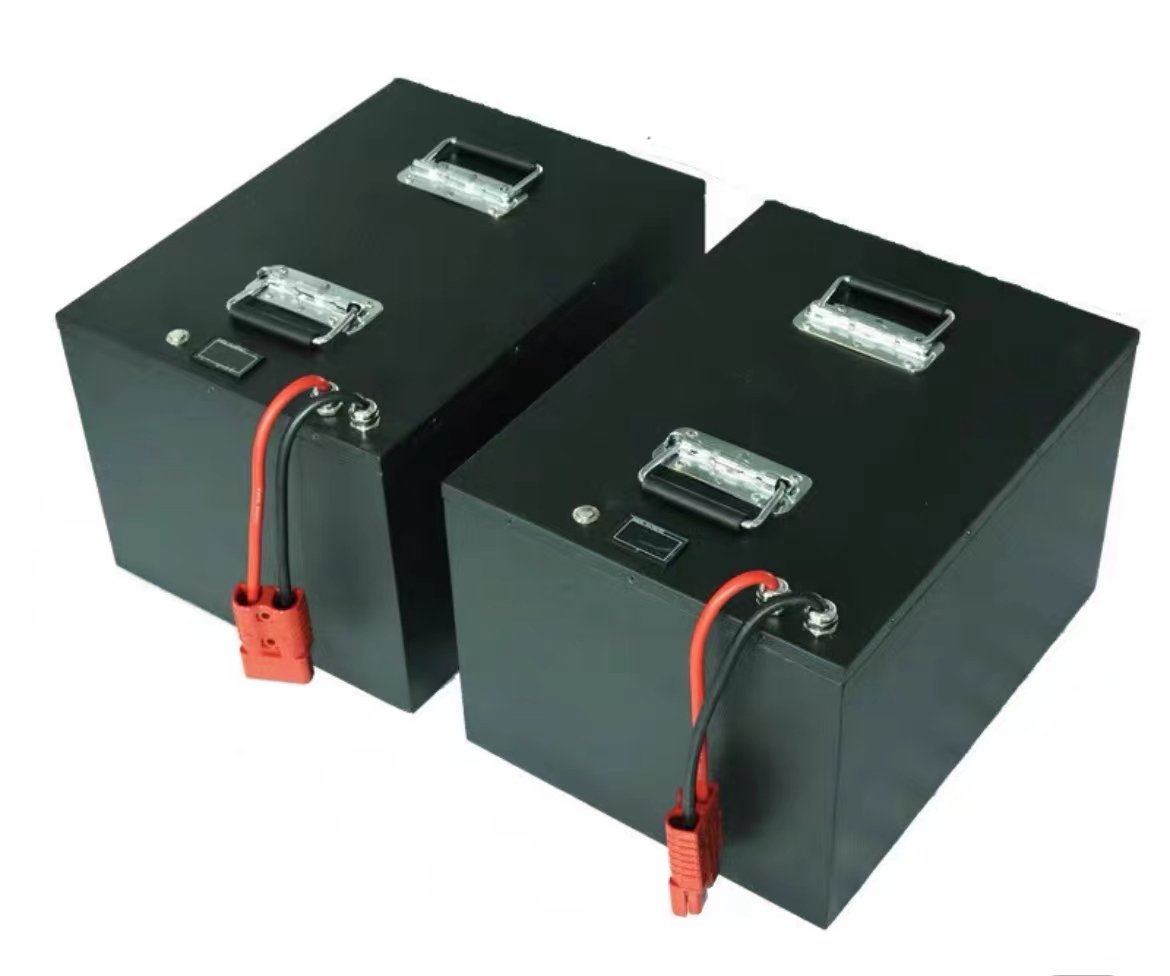
A cycle life figure on a lithium battery pack datasheet is a test result, not a property of the chemistry. “1,000 cycles” means nothing until you know the depth of discharge, the charge and discharge rates, the ambient temperature, the capacity criterion that defined end of life, and whether the number was measured on bare cells or on the finished pack. Two suppliers can quote 1,000 cycles for the same cell and be describing tests that differ by a factor of three in delivered energy. This article shows how to read the claim, and how to verify it with a test programme that fits an OEM qualification budget.

The five conditions behind every cycle life number
A cycle is a round trip: charge from a defined lower state of charge to a defined upper state of charge, then discharge back. The damage that round trip causes depends almost entirely on the boundaries you set. Five variables decide the result, and a datasheet that omits any of them has not told you how long the pack will last.
Depth of discharge (DOD). A cell cycled between 100% and 0% state of charge accumulates far more damage per cycle than one cycled between 90% and 20%. This is the single largest lever. Claims built on shallow cycling can look impressive while telling you very little about a device that runs the pack flat every shift.
Charge and discharge rate. High-rate charging is the harsher of the two for most lithium chemistries, because it drives lithium plating risk at low temperature and raises cell temperature at high state of charge. A “1C” claim needs to say whether 1C applies to charge, discharge, or both, and whether the charge was tapered.
Temperature. Cycle tests are usually run at 25 °C ambient because it is convenient, not because it matches your product. A pack inside a sealed enclosure in a Middle East installation or a cold-store application sees something different, and the number does not transfer.
The end-of-life criterion. Most claims stop at 80% of beginning-of-life capacity, some at 70%, and a few quote “cycles to 60%”. The criterion changes the number substantially, because capacity fade accelerates once the cell reaches its knee.
The test article. Cells on a rack and a finished pack with a battery management system (BMS) do not behave identically. The BMS decides when discharge ends, how balancing is applied, and at what temperature charging is inhibited, so its settings are part of the test condition.
| Datasheet element | What it usually says | What to require in writing |
|---|---|---|
| Cycle count | “≥ 1,000 cycles” | Count plus the SOC window it was measured over |
| End-of-life criterion | Often omitted | Capacity threshold (e.g. 80% of initial) and how capacity was measured |
| Charge protocol | “Standard charge” | C-rate, CV voltage, termination current, permitted temperature range |
| Discharge protocol | “1C continuous” | Rate, cutoff voltage, rest between half-cycles, pulsed or continuous |
| Test article | Ambiguous | Cell model and lot, or pack with defined BMS firmware and limits |
| Temperature | “Room temperature” | Ambient and measured cell temperature, plus cooling method |
Why cell-level cycle data does not transfer to the pack
Cell manufacturer endurance data is collected on single cells held at uniform temperature, usually with a fixed current and a laboratory-grade charger. A pack is a different thermal and electrical system.
Thermal gradient. Cells at the centre of a stack run hotter than cells at the ends. As a rough engineering approximation, reaction rates and ageing roughly double for every 10 °C rise, so a 6 °C gradient across a pack is enough to make the hottest cells age measurably faster than the average the datasheet describes. The pack therefore reaches its capacity threshold earlier than the cell data predicts, and the spread between cells widens.
String imbalance. In a series string, the weakest cell sets the pack limit. The BMS terminates discharge when the first cell hits the cutoff, so the pack delivers less energy each cycle while the remaining cells are still healthy. Capacity retention measured at the terminals and capacity retention measured per cell tell different stories, and only the second one predicts failure.
Balancing behaviour. Passive balancing dissipates milliamps; it can hold a matched string in line but cannot recover a string that has drifted. If balancing only runs at the top of charge and the device rarely reaches full charge, imbalance accumulates quietly. This is one reason cell grading and matching at assembly matters as much as the cell datasheet itself; our note on cell consistency, matching and balancing covers the assembly side.
Terminal-level rate. A 1C discharge at the pack terminals is not 1C through each cell once busbar, nickel strip, fuse and harness resistance are included. The cells work slightly harder than the label suggests, and the difference grows with pack size and connector quality.
Mechanical and environmental load. Compression, vibration and thermal cycling act on welds, joints and connectors. A pack can lose a connection before it loses capacity, which is why endurance testing and mechanical qualification are separate activities rather than one combined run.
How to read capacity retention data without fooling yourself
Capacity retention is a ratio: capacity at cycle N divided by capacity at cycle zero, both measured the same way. Three practical rules keep the comparison honest.
Measure under identical conditions. A capacity check at 0.2C and 25 °C, taken after a defined rest, is comparable with the same check at cycle 500. A check taken at 1C after a fast charge is not. IEC 61960-3 defines capacity and endurance measurement for prismatic and cylindrical lithium cells, and using its conditions as the reference removes most of the ambiguity without inventing your own method.
Look at the curve, not the endpoint. A pack that retains 92% at 400 cycles and 84% at 500 has entered its knee; the next 200 cycles will be worse than linear extrapolation suggests. Ask for the full retention table, not the single cycle count, and check whether the fade is linear or accelerating.
Know what the BMS is counting. A gauge that increments a cycle counter on every charge event will overstate cycle count for a pack that is opportunity-charged twenty times a day. A gauge that integrates coulomb throughput and divides by rated capacity reports equivalent full cycles, which is the number that correlates with ageing. The two counters can differ by an order of magnitude on the same pack, so state which one the warranty uses.
A verification plan sized for an OEM programme
Full endurance testing takes months, so verification is normally split into a short screen, a mid-life checkpoint and reliance on the supplier’s full data set. The table below is a workable structure for a 6 to 12 week qualification window; the acceptance values are examples and should be replaced with your own requirements.
| Test | Condition | Samples | Checkpoint | Acceptance (example) |
|---|---|---|---|---|
| Baseline capacity | 0.2C discharge, 25 °C, per IEC 61960-3 method | 5–10 production packs | t = 0 | ≥ rated capacity; unit-to-unit spread recorded |
| DC internal resistance | 1 kHz AC or 10 s pulse at 50% SOC | Same units | t = 0, 200, 400 cycles | Growth trend recorded; no step change |
| Cycle screen | The contracted SOC window and C-rates, 25 °C | 3–5 packs | Every 100 cycles | ≥ 95% of baseline at 200 cycles |
| Temperature rise | Worst-case continuous discharge in the enclosure | 1–2 packs | First week | Cell surface ≤ the limit agreed with the supplier |
| Balancing check | Repeated partial cycles without full charge | 2 packs | After 50 partial cycles | Cell spread stays within the BMS balancing window |
| Self-discharge | 30 days at 25 °C and at the storage temperature | 3 packs | Day 30 | Voltage loss within the declared rate |
Three to five packs is enough to catch gross design errors and to confirm that the shipped configuration behaves like the sample. It is not enough to demonstrate a failure rate. If the question is “what percentage of units will fall below 80% before year five”, the answer needs a statistically sized sample and a lot acceptance scheme, which is a different exercise from engineering verification; the NIST/SEMATECH handbook chapter on sampling and acceptance control is a practical reference for setting that up. When the endurance run has to be witnessed by someone outside the supply chain, publicly documented battery test facilities such as the Sandia energy storage battery test group are a useful reference for what a properly instrumented cycle test looks like.
What actually shortens life in the field
Field life is usually shorter than the datasheet, and the reasons are predictable. The table below maps the conditions that matter to the design or specification lever that controls them.
| Field condition | Effect | Lever |
|---|---|---|
| Storage at high SOC | Accelerated calendar fade before first use | Ship at 30–50% SOC; specify storage SOC in the purchase order |
| Charging below 0 °C | Lithium plating, permanent capacity loss | Charge inhibit in the BMS, plus pack heating where the duty cycle requires it |
| High ambient temperature | Faster fade across all cycles | Thermal path to the housing, derating, or chemistry change to LFP |
| Deep discharge and long rest at low SOC | Copper dissolution risk, capacity loss | Reserve SOC, low-voltage cutoff above the cell minimum, sleep current control |
| Fast charge at high SOC | Heat and plating during the constant-voltage phase | Temperature-limited current taper, charge window definition |
| Vibration and thermal cycling | Joint and weld fatigue | Strain relief, potting or conformal protection, vibration test at pack level |
Note what is missing from this list: the cycle count itself. For most OEM devices, calendar ageing and temperature exposure shorten service life more than cycling does, particularly in medical and industrial equipment that spends most of its life at rest. A pack specified for 1,000 cycles can still fail its three-year warranty if it is stored at 45 °C and 100% SOC between uses.
Turning the claim into a warranty position
A cycle life claim becomes commercially useful only when it is converted into expected service life at your duty cycle. The arithmetic is simple: expected cycles per year is annual energy throughput divided by usable energy per cycle; service life in years is contracted cycles divided by cycles per year, adjusted for the temperature exposure the product actually sees. Ask the supplier for the derating curve that supports that adjustment. A supplier that can only quote one number at 25 °C has not characterised its product.
Write the warranty so that a capacity claim can be tested. That means naming the measurement conditions, the instrument class, who performs the test, and the threshold that triggers replacement. Without that clause, a capacity dispute becomes an argument about test methods rather than a service action.
Keep the safety paperwork separate from the endurance claim. A pack holding an IEC 62133-2 report has demonstrated that it survives abuse tests such as external short circuit, crush, overcharge and thermal abuse; that report says nothing about capacity retention. Buyers sometimes treat the safety certificate as evidence of long life, and suppliers rarely correct the impression.
What to write into the purchase specification
Six lines close most of the ambiguity:
- Cycle life at a defined SOC window, C-rate, ambient temperature and capacity threshold, measured on the finished pack.
- The test standard used for capacity measurement, and the laboratory that performed the endurance run.
- Permitted derating assumptions for the operating temperature range, stated as a table rather than a sentence.
- BMS cycle-counting method, and confirmation that equivalent full cycles are reported over the communication interface.
- Storage SOC at shipment and the maximum storage temperature, with the calendar-life assumption that goes with them.
- A change-notification clause that requires re-testing when the cell, BMS firmware or thermal design changes.
These items belong in the RFQ package rather than in later correspondence, because they change the cell selection and therefore the price. Our RFQ checklist for custom battery packs places the life requirement alongside the load profile and compliance targets, which is where suppliers need it.
Frequently asked questions
Is 80% capacity the standard definition of end of life?
It is a common convention, not a rule. Automotive programmes often use 80%, stationary storage warranties often use 70%, and some medical device manufacturers set a functional threshold based on runtime rather than capacity. What matters is that the number is stated, measured the same way at both ends, and matched to the device’s performance requirement.
Can cycle life be verified in a few weeks?
Not fully. Raising temperature or charge rate to compress the test changes the degradation mode, so an accelerated result cannot be read as a scaled version of a ten-year life. A short programme can confirm baseline capacity, thermal behaviour and balancing, and can expose a design that is clearly outside its claim; the full endurance number has to come from the supplier’s data plus periodic lot verification.
Should we test cells or finished packs?
Finished packs, if the question is pack life. Cell-level testing answers a cell-sourcing question and is useful when you are comparing cell models or checking a second source. Pack-level testing captures the BMS cutoff, thermal design and interconnection losses that determine what the customer experiences.
Verifying the claim before the design freezes
Cycle life is one of the few specifications that cannot be inspected on receipt and cannot be corrected after tooling. It has to be pinned down in the specification, checked against a defined test, and protected by a change-control clause. If you are at the stage of writing that requirement, our custom lithium battery pack manufacturing team can review the duty cycle and propose a cell and BMS combination with the endurance data that supports it, and our incoming inspection plan covers the lot-level checks that keep a qualified design from drifting. Send the load profile and target life through the contact page to start the review.