State of charge (SOC) accuracy is one of the least standardized claims on a battery specification sheet. Two suppliers can both write “SOC accuracy ±5%” and deliver very different user experiences, because the number is only meaningful when the conditions are defined: at which temperature, at which current, after how long a rest, and over which SOC window. This article explains what SOC error actually consists of, where it comes from, what to write into a BMS requirement, and how to verify the claim on the bench before you accept a custom pack into production.
What “SOC accuracy” actually means
SOC is the remaining charge in a pack expressed as a percentage of its present full-charge capacity. The problem for buyers is that true SOC is never measured directly. The BMS estimates it from quantities it can observe: pack voltage, current, temperature, and time. SOC accuracy is therefore the size of the gap between the reported value and the true remaining charge, and that gap depends entirely on the method the BMS uses and the conditions it operates in.
A peer-reviewed review of SOC, SOH and RUL estimation techniques describes the main families of estimators and their trade-offs in detail; the practical takeaway for a buyer is that no single method wins in every operating point, and a responsible supplier will tell you which method their BMS uses and where it degrades.
Every estimation method has a weak spot. Open-circuit-voltage (OCV) lookup is accurate after a rest but ambiguous in the flat voltage plateau that dominates most lithium chemistries between roughly 20% and 80% SOC. Coulomb counting is reliable moment-to-moment but drifts over time because of current-sensor offset and an outdated capacity estimate. Model-based observers such as Kalman filters combine both sources and stay consistent across more of the operating envelope, but they need a validated cell model, and the model degrades as the cell ages. The spec you receive should reflect these limits rather than quote a single flattering number.
Where SOC error comes from
When a reported SOC drifts away from reality, the causes fall into a small set of physical and implementation sources:
- Current-sense offset and gain error. Coulomb counting integrates current. A small offset in the shunt or Hall sensor becomes a persistent SOC error that grows with time and only resets when the estimator re-references, for example after a full charge or a long rest.
- Capacity model error. The estimator divides integrated charge by a capacity value. As the cells age, true capacity falls, and an estimator that still carries the beginning-of-life capacity reads high.
- Flat OCV plateau. In the mid-SOC region, a large voltage change corresponds to a small SOC change, so voltage-based correction is weak exactly where the product spends most of its life.
- Temperature. Cell impedance and the OCV curve itself shift with temperature. An estimator calibrated at 25 °C misreads at −10 °C or +45 °C unless it is temperature-compensated.
- Cell imbalance. Pack SOC is usually inferred from a single “representative” cell or from pack-level values. Imbalance means the weakest cell and the pack average diverge, and the divergence grows with calendar life.
- Load transients. Under pulsed loads, instantaneous voltage is dominated by impedance, not by SOC. Estimators that lean on voltage during transients will swing.
SOC estimation methods at a glance
| Method | How it works | Strengths | Weak points | Typical use |
|---|---|---|---|---|
| OCV lookup | Maps rested open-circuit voltage to SOC via a cell curve table | Simple; accurate after a long rest; needs no current sensor | Ambiguous on the flat plateau; wrong under load; slow to converge | Low-cost packs; correction reference after rest |
| Coulomb counting | Integrates measured current over time against a capacity value | Good dynamic tracking; predictable behavior | Drifts with sensor offset and stale capacity; needs periodic re-referencing | Baseline method in almost every BMS |
| Model-based observers | Fits an equivalent-circuit cell model and runs a Kalman-type filter | Consistent across SOC range and temperature; converges after disturbances | Requires a validated model per cell type; computational effort; model ages with the cells | Premium packs: medical, robotics, meters that must report trustworthy SOC |
| Hybrid (OCV + coulomb counting + observer) | Uses rests to re-reference the integrator and the model to bridge loads | Best practical accuracy; self-correcting | Most engineering effort; tuning quality varies between suppliers | Custom packs with reporting requirements over CAN/SMBus |
What to write into the BMS requirement
Because “±5% SOC accuracy” is meaningless on its own, the requirement should pin the conditions under which the number applies. The lines below are example wording you can adapt; they define the envelope, the exceptions, and the reporting format.
| Requirement line | Example wording | Why it matters |
|---|---|---|
| Accuracy band and window | Reported SOC within ±5% of reference over 10–90% SOC at 25 °C, charge or discharge current ≤ C/5 | Restricts the claim to the region where voltage-based correction is actually possible |
| Endpoint behavior | SOC shall read 0% when the fully discharged cutoff voltage is reached and 100% at termination of a manufacturer-specified full charge | Anchors the estimator to physical events so drift cannot accumulate indefinitely |
| Re-referencing | Estimator shall re-reference after any rest ≥ 30 min using the OCV curve; convergence within ±3% after 2 h rest | Defines how drift self-corrects instead of leaving it to chance |
| Temperature compensation | SOC error band shall hold from 0 °C to +45 °C; outside this range the pack shall flag degraded SOC confidence | Prevents silent misreporting in cold or hot duty |
| Aging | Capacity estimate shall be updated from full-charge events; accuracy claim shall hold after 300 cycles at rated conditions | Keeps the reported SOC honest as the pack ages |
| Reporting | SOC reported over CAN/SMBus at 1% resolution, update rate ≤ 1 s, with a defined value when the estimator is uninitialized | Makes the value usable by your host firmware and testable on the line |
For measurement-quality context when you define acceptance limits, the NIST/SEMATECH e-Handbook of Statistical Methods is a practical reference for stating uncertainty and deciding how much of the error band belongs to the measurement system rather than the device under test.
How to verify SOC accuracy on the bench
SOC verification is a differential test: you compare the pack’s reported value against a reference you construct yourself. The usual reference is coulomb counting with a calibrated current shunt, anchored at known physical points (a full charge and a controlled full discharge), and cross-checked with OCV rests at defined SOC points. IEC 61960-3, the performance standard for prismatic and cylindrical lithium cells, provides the capacity-test framework that gives you a trustworthy full-capacity baseline; without a measured capacity baseline, any SOC error figure is built on sand.
| Test | Condition | Reference | Example acceptance |
|---|---|---|---|
| Static accuracy | 25 °C, C/5 discharge, reported SOC sampled at 10% steps | Calibrated shunt integration anchored at full charge | |error| ≤ 5% at every step |
| Dynamic accuracy | 25 °C, pulsed profile matching your duty cycle (e.g., 2C pulses, 30% duty) | Shunt integration; voltage relaxation ignored during pulses | |error| ≤ 7% over the profile |
| Convergence after rest | Interrupt mid-discharge, rest 2 h, read SOC before and after | OCV lookup at the rested voltage | Reported SOC moves to within ±3% of OCV-derived value |
| Temperature sensitivity | Repeat static accuracy at 0 °C and +45 °C | Shunt integration with temperature-recorded capacity baseline | Within the band stated in the requirement, or confidence flag raised |
| Aged behavior | Repeat static accuracy after 300 cycles | Re-measured capacity baseline | Accuracy claim still met; no persistent high bias |
| Endpoint integrity | Full discharge to cutoff; full charge to termination | Direct voltage termination criteria | SOC reads 0% / 100% within one update cycle |
Two practical notes. First, your own test station becomes part of the accuracy claim: a current transducer with 1% error cannot referee a ±3% SOC claim, which is why the measurement-uncertainty planning referenced above belongs in the test plan, not only in the datasheet. Second, if the pack will be qualified by a third-party lab, agree the reference method in advance; independent battery test facilities such as Sandia National Laboratories’ Energy Storage Systems program publish their testing frameworks and can serve as a model for what a defensible test report contains.
Common failure patterns in incoming SOC verification
When packs fail this kind of verification, the same few patterns recur:
- Symmetric drift that resets at full charge. Classic coulomb-counting offset. Acceptable in products that fully charge regularly; a defect in products that float or partial-charge.
- SOC stuck near a fixed value. The estimator is falling back to voltage-only mode and the plateau makes it read mid-range. Indicates the OCV correction is disabled or misconfigured for the cell type.
- Large error only at temperature. Missing temperature compensation, often exposed the first time the pack is tested in a chamber instead of on a room-temperature bench.
- Error growing with cycle count. Capacity estimate not being updated, so the estimator runs on beginning-of-life capacity while true capacity has fallen.
Documenting which pattern you see, with the conditions that reproduce it, turns a vague complaint into an actionable engineering finding for the supplier. Our articles on battery pack incoming inspection and cycle life datasheet verification cover the neighboring checks that round out an acceptance plan.
Frequently asked questions
Is ±3% SOC accuracy achievable in a production pack?
It is achievable under defined conditions with a hybrid estimator, a quality current sensor, and periodic re-referencing, and it should be specified and verified per the method above. An unconditioned ±3% claim quoted without temperature, current, and rest conditions is a red flag rather than a promise.
Do I need SOC accuracy better than ±5%?
Only if your product makes decisions from the value: range or runtime prediction, load shedding, or regulated reporting to an end user. For a device that simply charges when convenient, looser bands with honest endpoint behavior cost less and fail less.
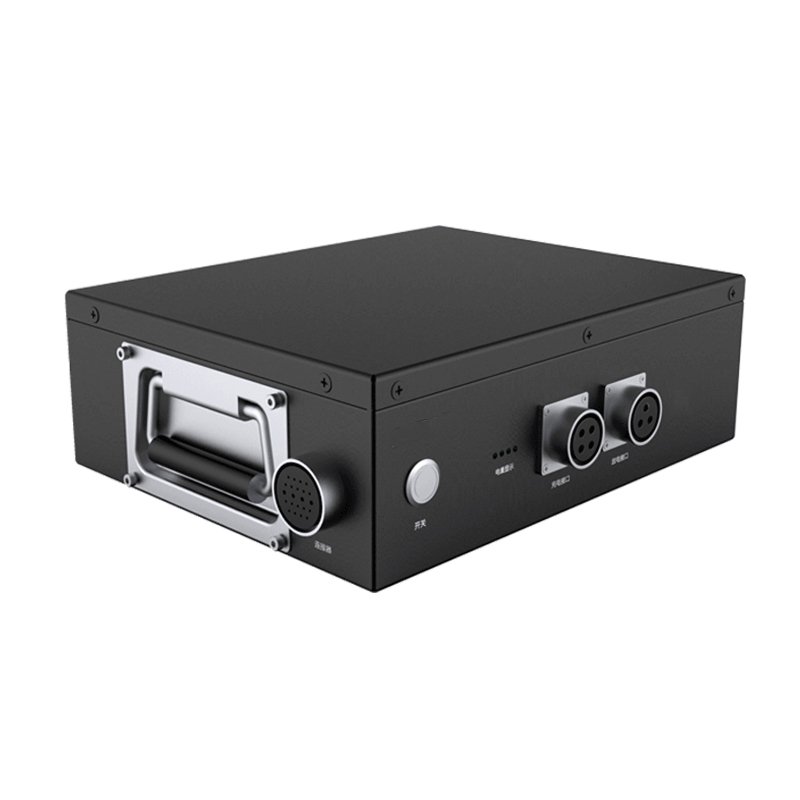
If you are preparing a BMS requirement for a custom pack and want the SOC specification reviewed against your actual duty cycle, our engineering team works from your load profile and reporting interface. See our smart battery pack with BMS capability and our overview of battery management system functions, or contact us to start the discussion.